
Posted in Blog, Design Thinking, Grow, Innovation, Launch Your Business by Jo North
The purpose of this article is to bring two classical innovation and business growth concepts – the Product Lifecycle and the Innovation-Adoption curve – into your new product development, business planning and strategic thinking.
The Product Lifecycle and Innovation-Adoption Curve
- There are four stages of the classical Product Lifecycle. These are: introduction, growth, maturity, decline.
- Product extension is when the product lifecycle is extended beyond decline by innovating a new growth curve.
- The Gartner Hypecycle is a technology-focused variation of the classical product lifecycle.
- Rogers’ Innovation-Adoption curve segments customers into five groups, depending on how readily they take up new products. These segments are: innovators, early adopters, early majority, late majority and laggards.
- It’s important to use insights from these models to make sure that your products and services are up to date and aligned with market demands, so that your business stays healthy.
Use these proven frameworks to help turn your business ideas into reality.
Product Lifecycle and New Product Development
The Product Lifecycle and Innovation-Adoption Curve were originally published back in the 1960s and are well-known management models. However, their relevance is still as strong and meaningful today as it was back then.
I find that, although many of the entrepreneurs and innovators that I work with know something of these concepts, they rarely use them in practice as tools for strategic planning, innovation and ultimately business growth.
The principles of these concepts are straightforward and highly useful.
I hope that you take a few minutes to consider the questions I suggest for your business as you read through this article.
I would love to hear about any insights you get from actually applying these tools to your own business context – please do use the contact form below to get in touch with me direct.
I promise to reply to every email that I receive about this article. I hope that you enjoy the article and find it thought-provoking and useful.

Definition of the Product Lifecycle
Products, like people, have lifecycles.
The Product Lifecycle outlines the stages a product goes through from starting as an idea to being removed from the market.
New, more contemporary products grow, if they are successful, over time.
Older, more established products eventually become less popular over time.
Not all products survive to reach final stage, however. Demand for some continues to grow, whilst for others demand may rise and fall.
It’s really important to make sure that your products and services are up to date and aligned with market demands of course so that your business stays healthy. Every business needs to be constantly innovating to make sure that their value proposition truly fits the current and future needs of its target customer segments.
Stages of the Product Lifecycle
The product life cycle is broken into four stages: introduction, growth, maturity, and decline.
Introduction Stage
This stage of the Product Lifecycle is typically the least profitable due to investment in research and development, and low sales volumes in the beginning – unless there is substantial marketing investment and exceptionally high demand for the new product in the run up to, and during, its launch.
It is usually important to keep costs as low as possible, and to accelerate launch plans to achieve a breakeven point as efficiently and effectively as possible.
Growth Stage
If the new product takes off successfully, introduction is followed in the Product Lifecycle by the growth stage.
This usually features strong growth in sales and profits, and healthier cash flow means that more investment can be made in marketing to help product sales continue to grow.
Maturity Stage
During the maturity stage of the Product Lifecyle, the product is established, sales begin to plateau over time, and the business focus is usually on preserving and maintaining market share.
Decline Stage
Eventually, the demand for a product will start to decrease, and this is what’s known as the decline stage of the Product Lifecycle.
This decline could be due to the market becoming saturated with the product or because customers are switching to a different product.
While this decline is often natural over time, the product may continue to be profitable for a while.
Product Lifecycle Extension
Sometimes products do become obsolete.
It’s often possible, though, to extend the lifecycle of a product by updating or improving it, marketing the new and improved version, and starting a new growth curve.
The best time to take action is before product sales decline, when growth has perhaps slowed down for some time. This means that you have a re-boot or replace solution in place before decline takes place, and the cash availability to invest in new product development.
A technology-specific Product Lifecycle – the Gartner Hype Cycle
Gartner is a world-class, leading research and advisory company that provides flagship technology research to provide senior business leaders with evidence-based insights, advice and tools for future strategic planning.
Gartner Hype Cycles provide a graphic representation of the maturity and adoption of technologies and applications. They show how useful and practical technologies are for being used in real world opportunities and environments.
Gartner Hype Cycle visuals are produced each year and project how a technology or application will evolve in the future, providing intelligence to support business decision making with regard to technology investment and deployment. Here is their summary of Top Strategic Technology Trends for 2023. You can see how the trends evolve and change each year by looking back at previous years.
Each Hype Cycle shows where technology sits in relation to the five key phases of a technology’s life cycle. These five key phases are:
- Innovation Trigger: Potentially exciting technological breakthrough attracts attention and publicity. Pragmatic application or proof-of-concept has not been established yet.
- Peak of Inflated Expectations: Some success stories are published, but there are also plenty of failures.
- Trough of Disillusionment: Early promise begins to degenerate into disappointment as products don’t live up to expectations. Product success and ongoing investment relies on the support of early adopters (see the next section of this article).
- Slope of Enlightenment: There is greater understanding of how the technology can benefit businesses. Uses and potential for the technology become more widely understood. Second- and third-generation products appear from technology providers. More businesses invest in trials. Traditional companies remain unsure.
- Plateau of Productivity: Mainstream adoption starts to take off. Criteria for assessing provider viability are more clearly defined. The technology’s broad market applicability and relevance are clearly paying off.
Hype Cycles help business decision-makers to:
- Sort out the hype from the real, practical and commercial potential of a technology innovation.
- De-risk technology investment decisions to some degree.
- Complement the business’ own views and technology forecasts with those provided by Gartner as an independent expert.
Where are your products and services in the Product Lifecycle?
If you have existing products and services, plot where each one of them is on the lifecycle diagram below.
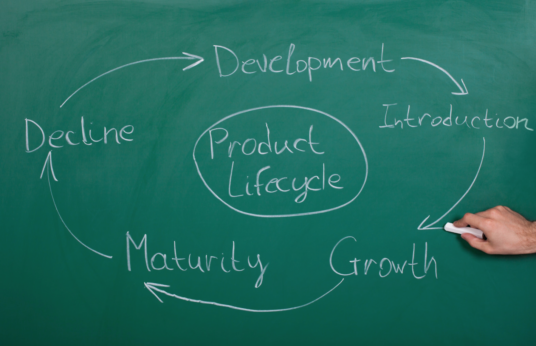
Now review your work and note down anything that you notice, and how those observations might help your business success. For example, are your products and services spread evenly across the stages, or clustered into a couple of stages?
Are you thinking that you might need to pivot? If so, check out my article and resources on How to Pivot here.
Introducing the Innovation-Adoption Curve
Definition of the Innovation-Adoption Curve
Research by Everett Rogers* showed that not everyone will buy into an innovative new product when it is first introduced to the market. His work is now a “classical” piece of business insight and is a useful tool for forecasting new product demand, especially when the product is radically different from anything else that exists on the market.
If you’d like some more detailed and specific information about forecasting, business case creation and business decision-making, I have a set of free resources that you can access here.
Rogers segments customers into 5 types based on how they respond to innovative new products.
Rogers’ Customer Segments on the Innovation-Adoption Curve
Innovators (2.5%)
Innovators are the first individuals to adopt an innovation.
Innovators are willing to take risks, youngest in age, have the highest incomes and greatest awareness and understanding of scientific developments and relationships with other innovators.
Because they are used to innovation culture and have financial means, this segment of customers is more likely to take a risk on buying an innovative new product when it hits the market.
Early Adopters (13.5%)
This is the second fastest segment of customers to adopt an innovation.
These customers have the highest influence among the other adopter segments.
Early adopters are typically younger in age, have a higher income, advanced education, and wider social networks than late adopters.
They are more discerning about their buying decisions than innovators and use their purchases to help enhance their social standing amongst their peers.
Early Majority (34%)
Early majority customers buy innovative products later than early adopters.
Rogers identified that they have above average income and social connection with early adopters, but are usually not influencers or opinion leaders.
Late Majority (34%)
People in this segment are a little behind the curve when it comes to buying innovative new products. They are cautious and risk averse when it comes to innovation and are not too interested in social influence or trends.
Laggards (16%)
Laggards are the last customers to adopt an innovation. They tend to dislike change and are often seen as traditionalists.
The Innovation-Adoption Curve and Your Business
It is important to remember that people are not always in the same segment for all of their purchasing decisions when it comes to innovative products. For example, someone may buy the very latest tech, but shop for conservative clothing at high street stores. We make different decisions based on the problems our purchases are intended to solve how interested we are in a particular area of innovation.
Take some time now to consider the products in your business, and any new products that you are thinking of launching. How does the Innovation-Adoption curve apply to each of them?
How can you strengthen your sales and based on these insights?
BCG (Boston Consulting Group) Matrix or Growth Share Matrix
Another classic model to help with product lifecycles for your business is the Boston Consulting Group (BCG) Matrix, or Growth Share Matrix. Created back in 1968 by BCG’s founder Bruce Henderson, it is a different way of presenting the principles of the product lifecycle. It helps you to consider your portfolio of products by identifying each as a cash cow, rising star, dog or question mark based on two axes: market share and market growth.
You can use the BCG matrix to get a snapshot of the overall health of your product portfolio. Ideally, you’ll have plenty of products in the cash cow and star categories, maybe a couple of question marks and zero dogs. Use these insights to shape your new product development and product portfolio strategies.
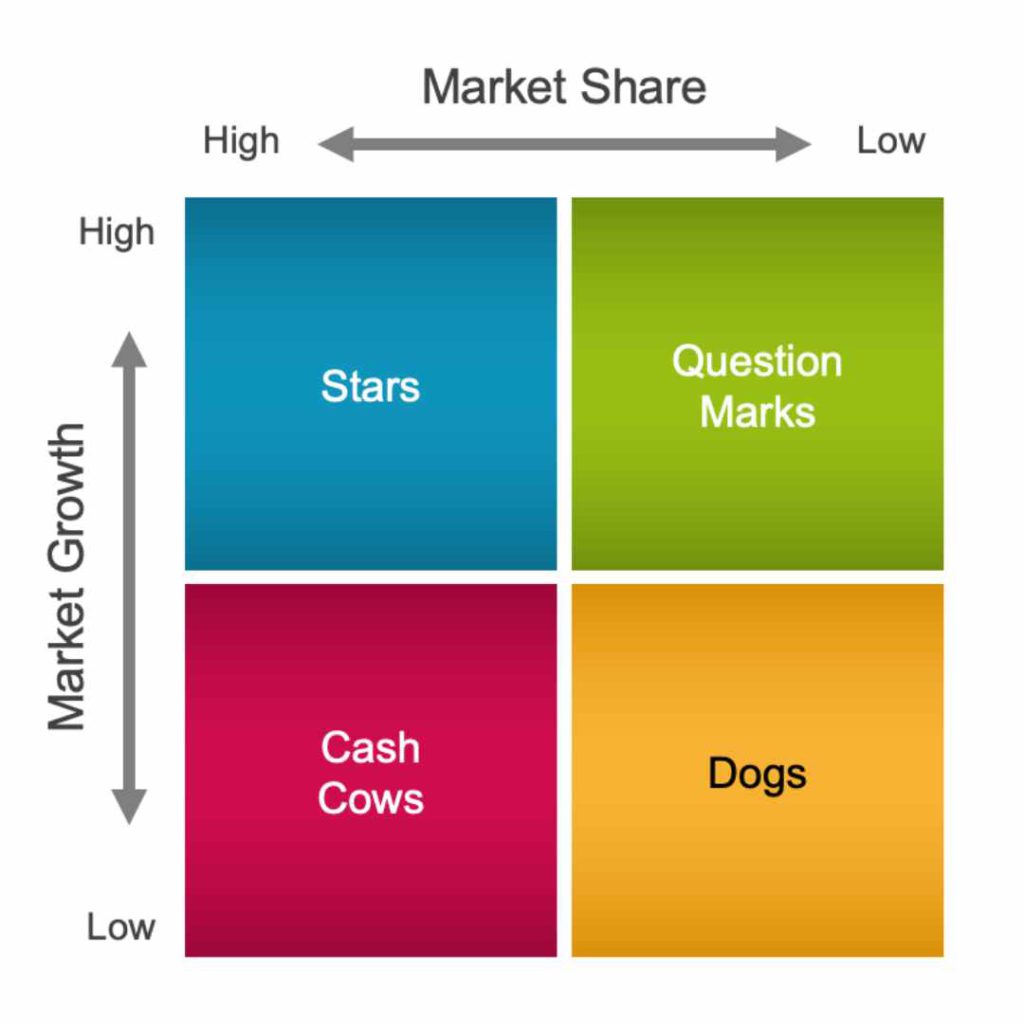
BCG Matrix and Product Types
Dogs have low market share and low growth. If these characteristics apply to any of your products, it’s time to exit them from your portfolio unless there is a genuine need to keep them.
Cash cows are products that have have steady growth and good market share, giving good income predictability and healthy margins. They fund the development of new rising star products (see below). Be careful, though, because if you don’t nurture your cash cows, over time they will turn into the dogs of tomorrow.
Stars are those products that are showing high growth and market penetration. They tend to be the more innovative and recent products in your portfolio that are showing signs of good promise. Stars will benefit from appropriate marketing and promotional support to help them fly. Over time, today’s rising stars will become the cash cows of tomorrow.
Question marks are products that are in high growth markets, but are not attracting high market share. These products could be time-consuming and expensive to maintain. Your decision with these products is whether you think they have enough potential to warrant the investment they need to become future stars, or are they likely to become dogs. If the product is a potential dog of the near future, you might want to consider exiting sooner rather than later to minimise your sunk costs.
Business Growth
If you want to strengthen your product development and idea commercialisation, or reposition your products and services to be more aligned with developing customer trends and market changes and would like some help, please get in touch. We can help you with our innovation consulting and facilitation of innovation sprints and other innovation events. We’d love to hear from you.
Contact us to create some time for you to think freely, fearlessly, explore options and risks, and make the best decisions for you and your business.
We also provide an invaluable expert perspective and fresh pair of eyes. Our only aim is to help you succeed.
(*From Diffusion of Innovations, 3rd edn. 1983)